Query Logs
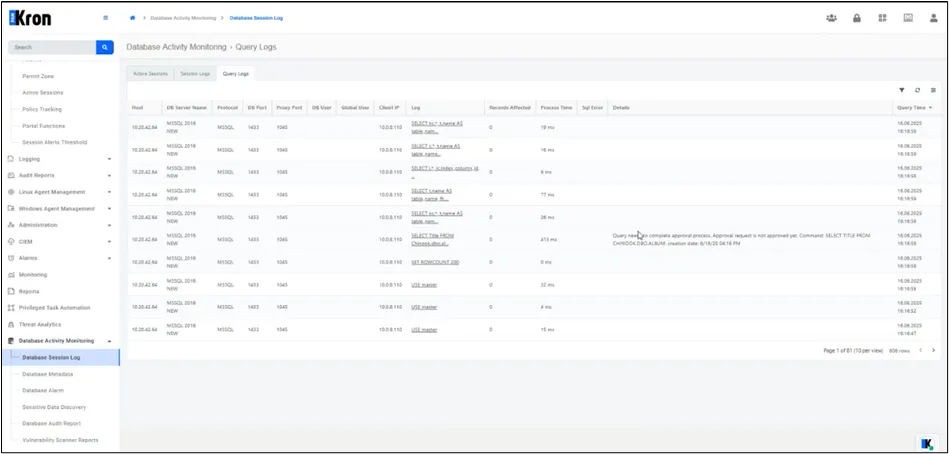
The Query Logs tab, accessible from Database Activity Monitoring > Database Session Log > Query Logs. It presents all SQL statements executed by users within each session. This feature is critical for auditing and understanding user behavior in the database.
Fields | Description |
|---|---|
Host | IP address of the target database device. |
DB Server Name | Name or label of the connected server. |
Protocol | Database protocol (e.g., Oracle, MSSQL, PostgreSQL). |
DB Port | Original database port. |
Proxy Port | The SQL Proxy port is set for this session. |
DB User | The user credentials are used at the database level. |
Global User | The Kron DAM user is associated with the session. |
Client IP | IP address of the connecting client. |
Log | The full SQL query text (e.g., SELECT, UPDATE, DELETE). |
Records Affected | Number of rows impacted by the query. |
Process Time | Duration of the query. |
SQL Error | Any error message returned by the database engine. This field is supported by Oracle, MSSQL, PostgreSQL, and MySQL |
Details | Displays masking behavior, approval requirements, or execution status. Queries tagged with a black key will be labeled as Not Executed. Masked queries or blocked queries will also appear here. |
Query Time | Timestamp of the SQL command execution. |
*Proxy User Enforcement | This field is supported only for Oracle. |
*Rows Affected | This field is supported by Oracle, MSSQL, and PostgreSQL. |
sql.proxy.metadata.sync.period: This parameter determines the interval (in milliseconds) at which metadata is fetched or synchronized from the database. The default is 30000 (30 seconds).Adjust itbased on the frequency of metadata changes and performance needs.