Monitoring
Pipeline Monitoring
Monitoring TP's itself provides several benefits that contribute to the overall health, efficiency, and reliability of the system. Here are some key advantages users can achive through using KronDSP's monitoring functions:
Early Detection of Issues: Monitoring the telemetry pipeline allows for the early detection of potential problems or anomalies in the data collection, processing, or transmission stages. This enables proactive measures to address issues before they impact the quality of telemetry data or downstream processes.
Resource Utilization: Monitoring helps track the utilization of resources such as CPU, memory, storage, and network bandwidth within the telemetry pipeline. This insight is crucial for resource planning, scaling, and ensuring that the infrastructure meets the demands of data processing.
Scalability Planning: As data volumes grow, monitoring the telemetry pipeline provides insights into scalability requirements. Understanding the trends in data ingestion and processing helps organizations plan for future scalability needs, ensuring that the pipeline can handle increasing data loads.
Historical Analysis: Monitoring data over time allows for historical analysis of the telemetry flow. This historical perspective is valuable for trend analysis, capacity planning, and understanding how the system changes overtime.
Self Monitoring
Although Kron TP is primarily used to handle observability data from a wide variety of sources, we also strive to make Kron TP highly observable itself. To that end, Kron TP provides two sources, internal_logs and internal_metrics that you can use to handle logs and metrics produced by Kron TP just like you would logs and metrics from any other source.
Overview Monitoring
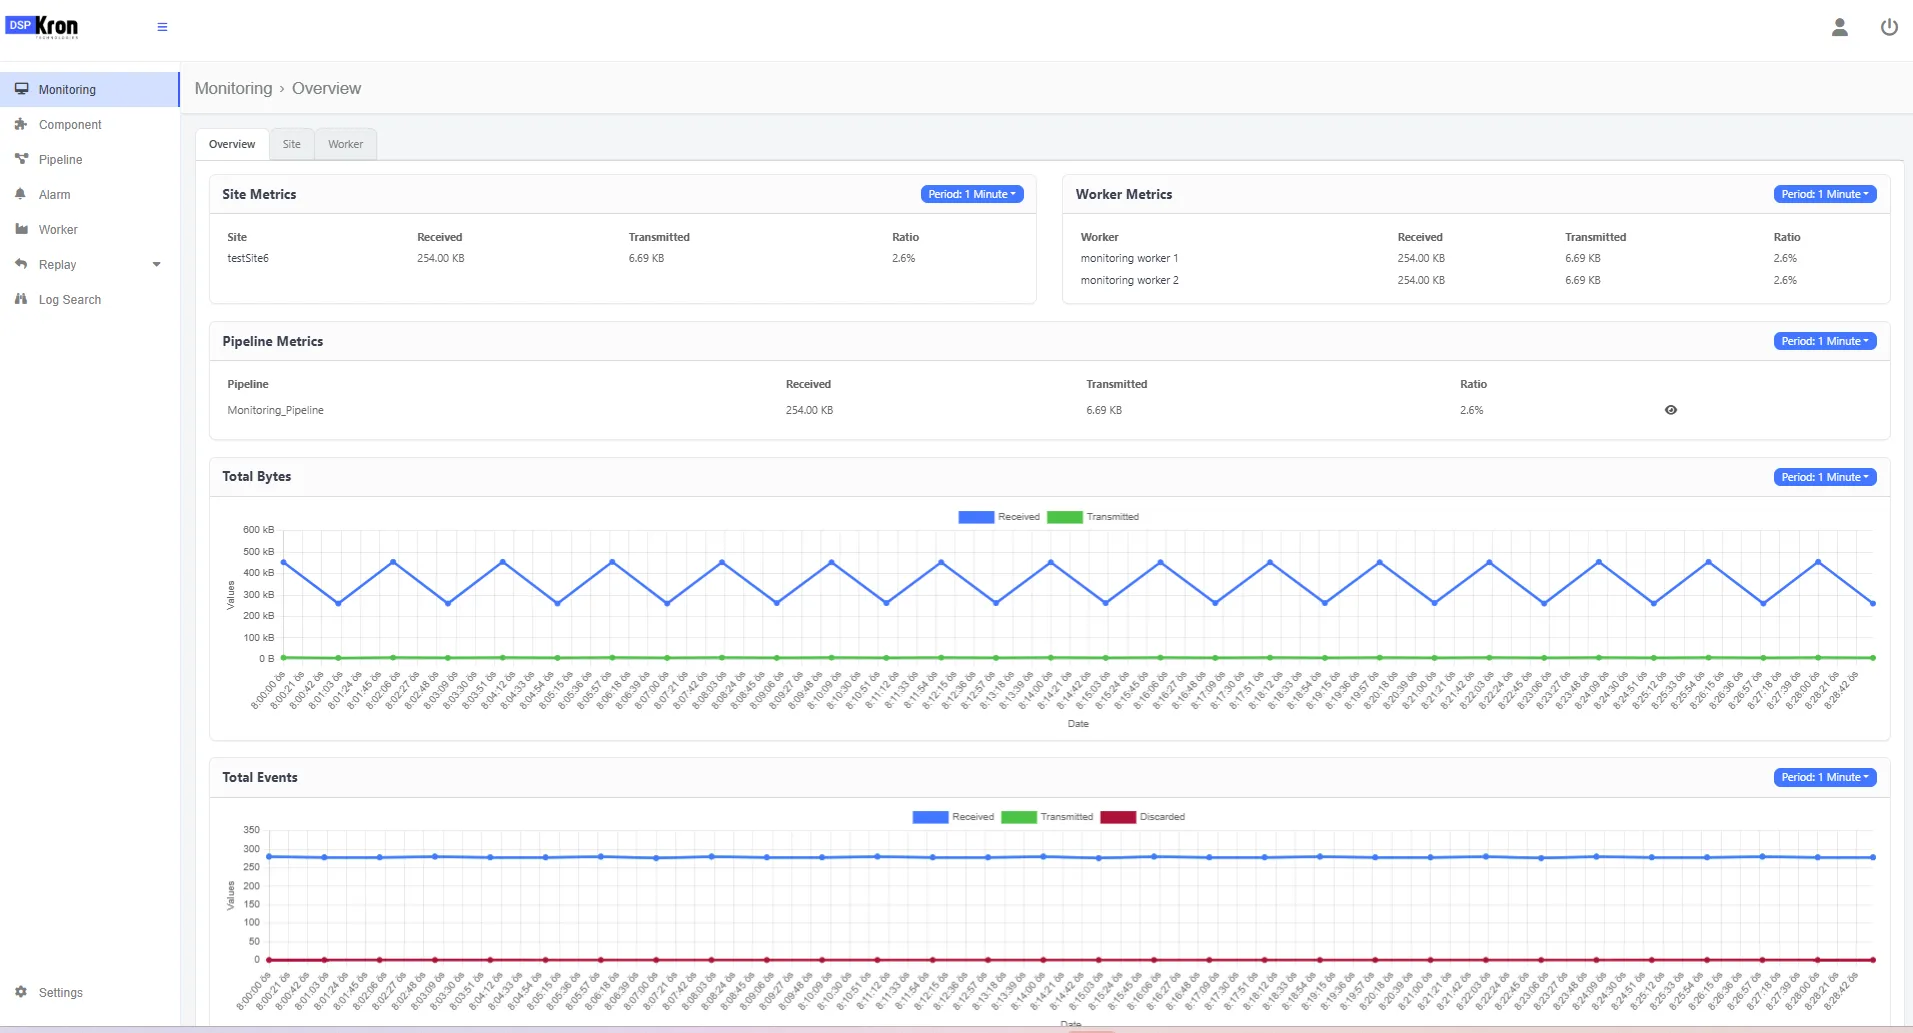
Overview represent all the data coming from all the sites combined.
Icoming and outgoing total bytes and total events can be seen from graphs.
From this view, you can see sites, the top-performing workers, and pipelines. To navigate to each component, simply click on the relevant name for each type.
Site Monitoring
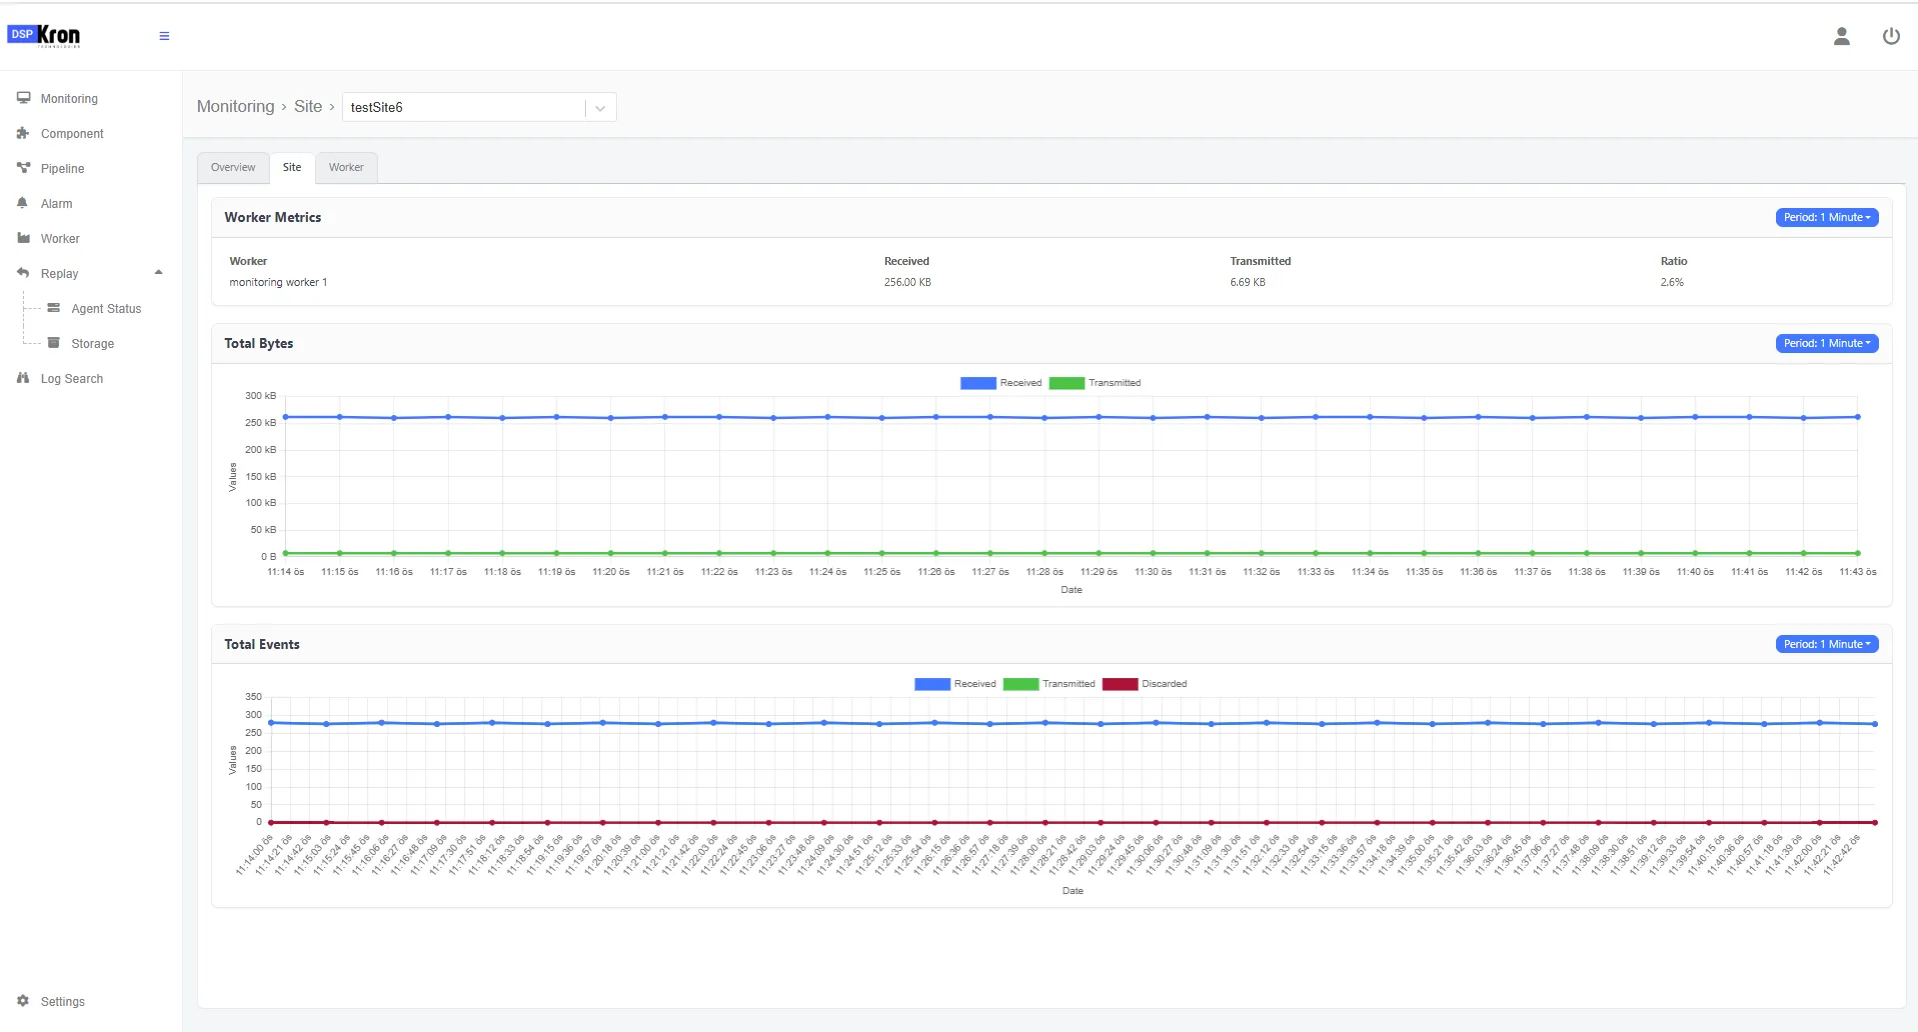
Under each site selected workers will be displayed and their load will be added together for total bytes and events metrics.
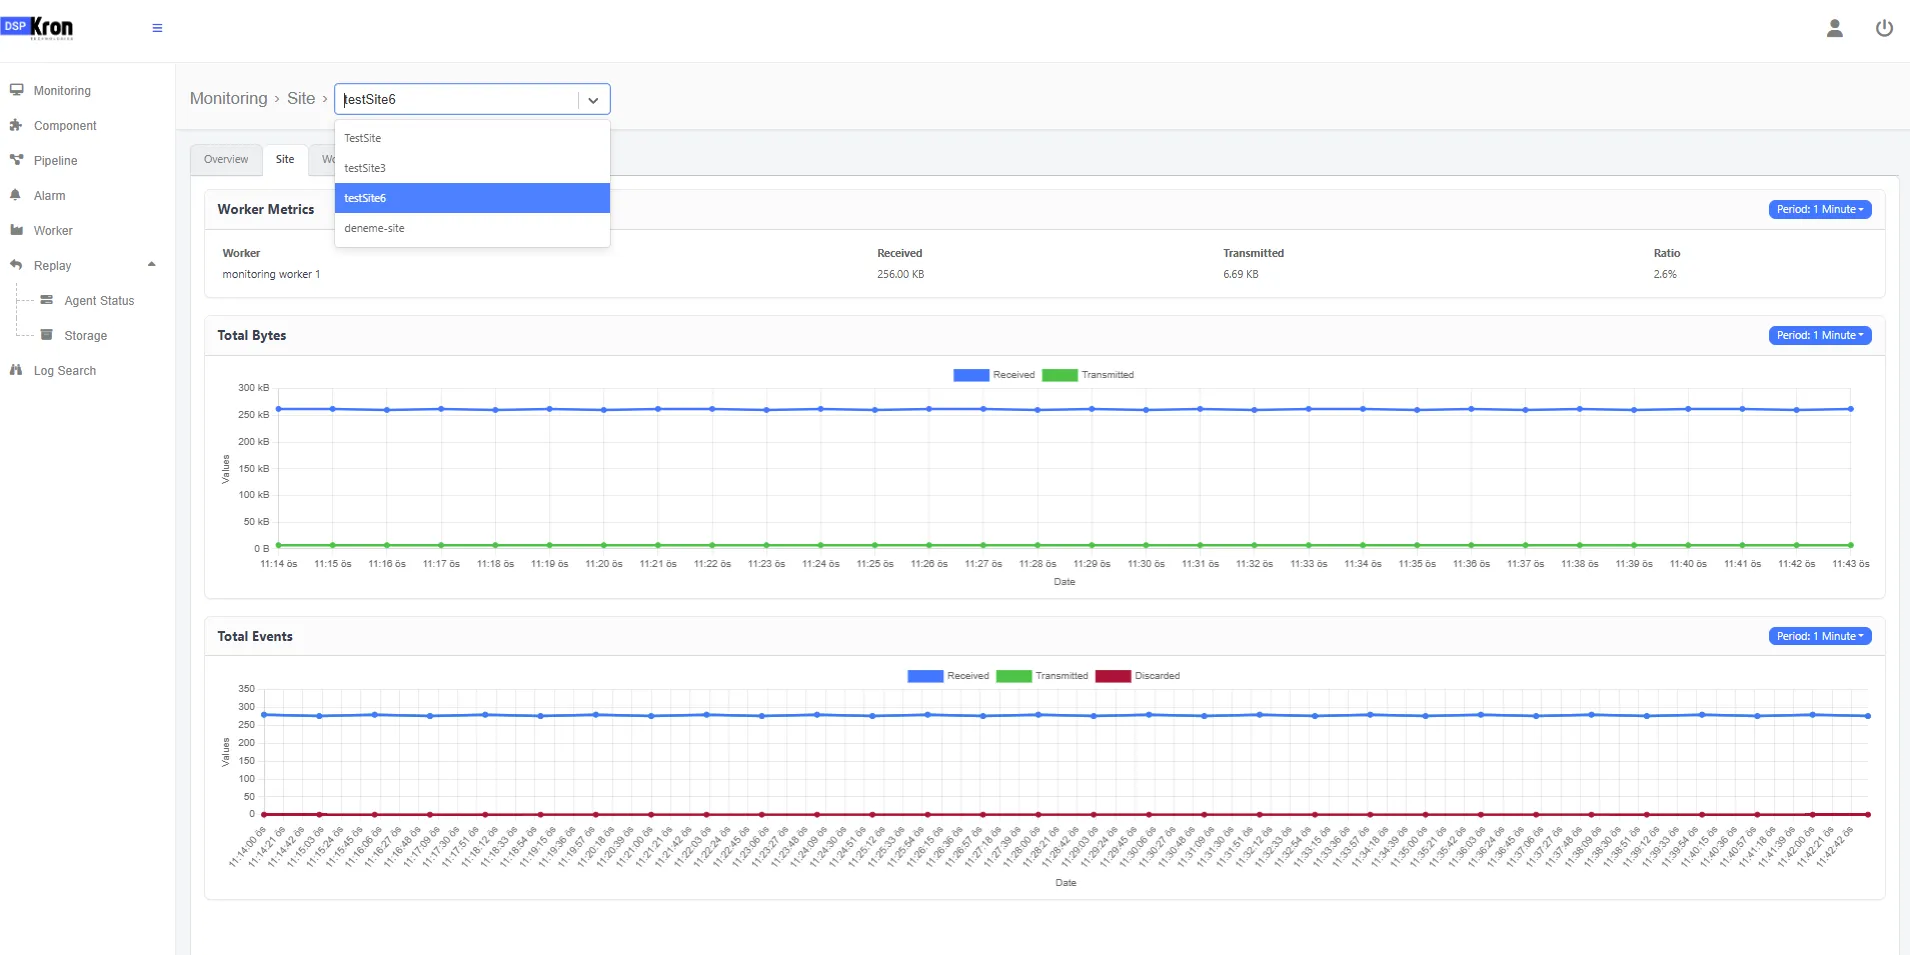
The monitored site can be changed through the top menu.
Worker Monitoing
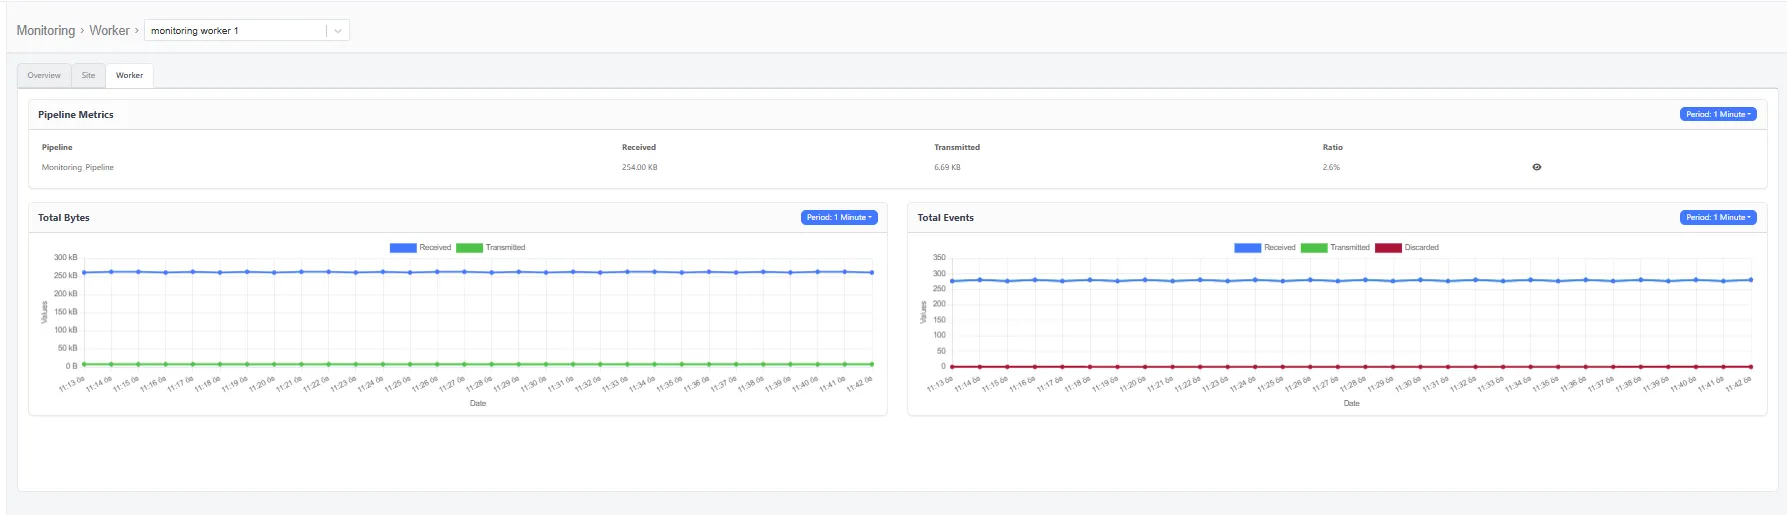
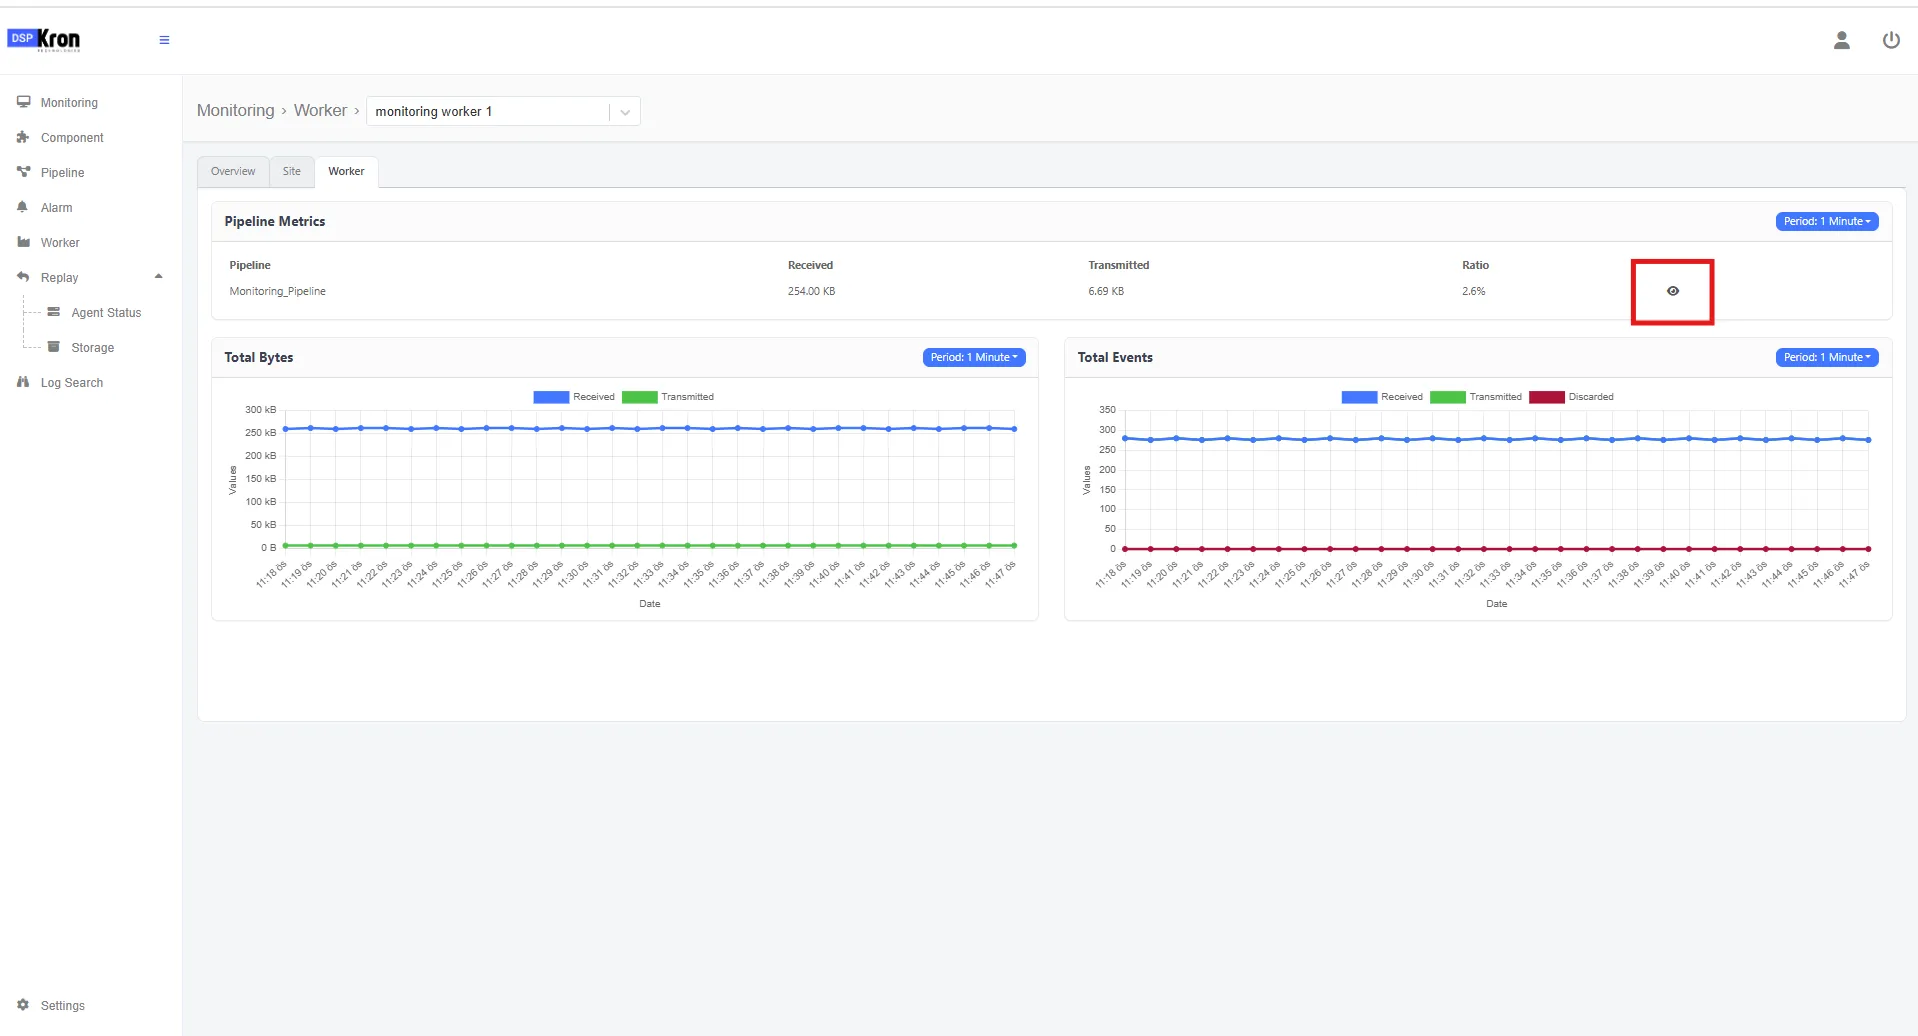
Each pipeline that is generating data and their total load can be displayed.
Pipeline Monitoring
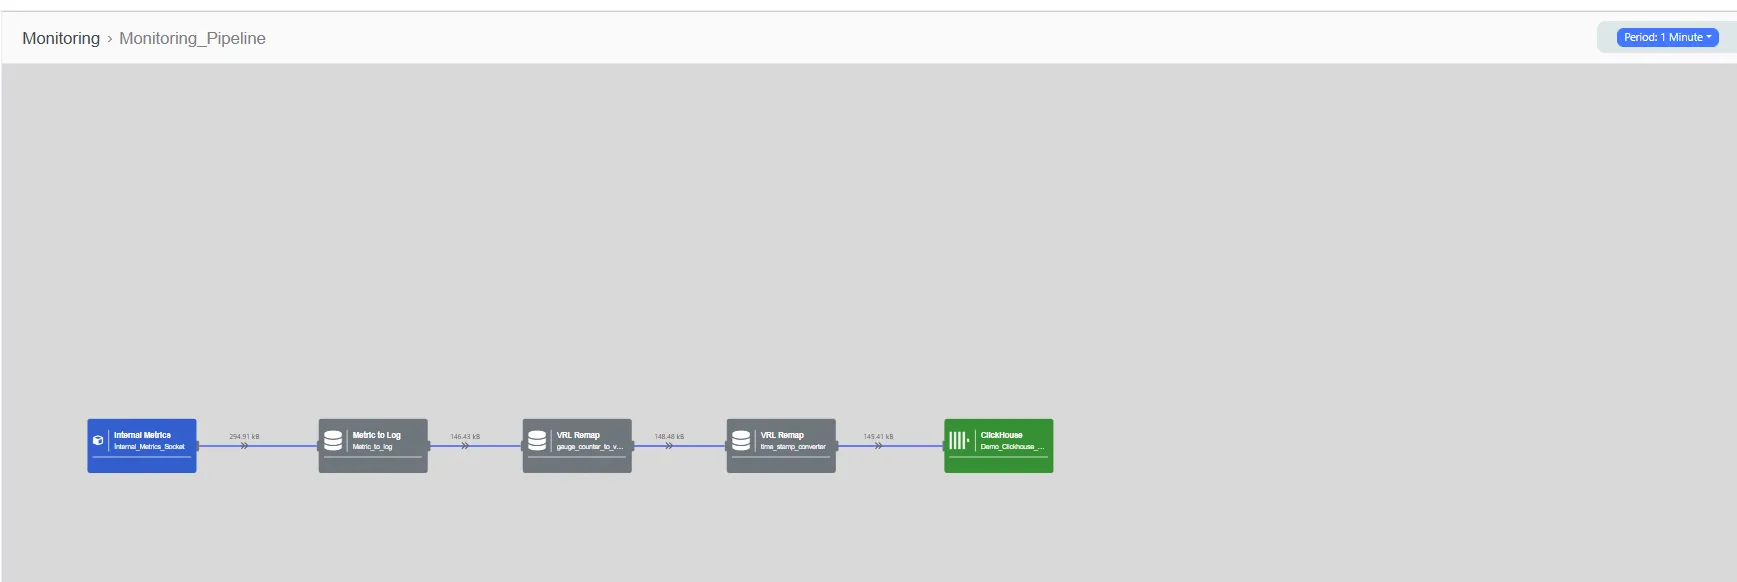
With the detailed view button next to each pipeline detailed insights can be gathered.
Here the user can view how much the data size is effected from the transform functions.
How much data is going to a spesific destination or how much data is being generated from a spesific source can be tracked aswell.
Exporting Metrics
You can monitor metrics produced by Kron TP using the internal_metrics source. As with Kron TP's internal logs, you can configure an internal_metrics source and use the piped-in metrics however you wish.