Performance Trends
This section illustrates CPU, RAM, and Disk usage trends. Each tab represents a separate monitored element.
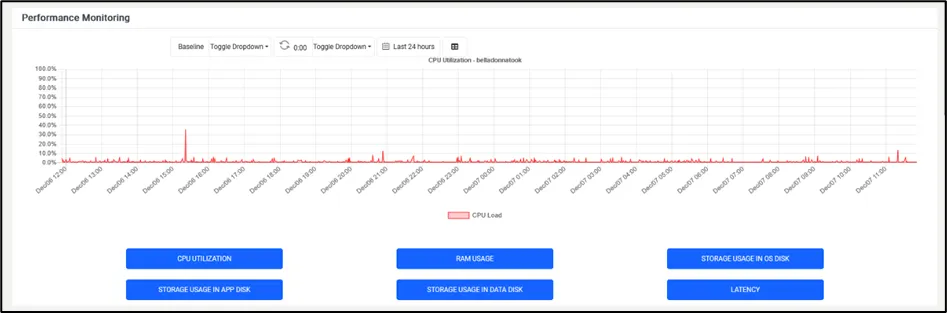
Performance Trends
The data can be filtered from the top right corner, with different time ranges:
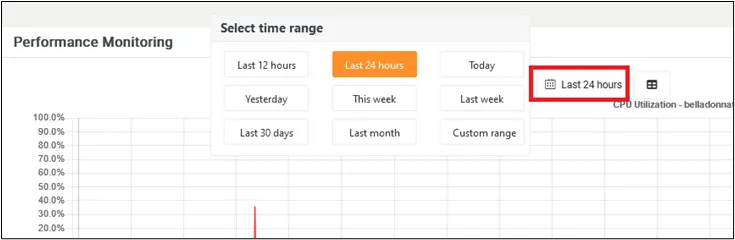
Filtering for the charts
The latency tab illustrates the latency between all nodes:
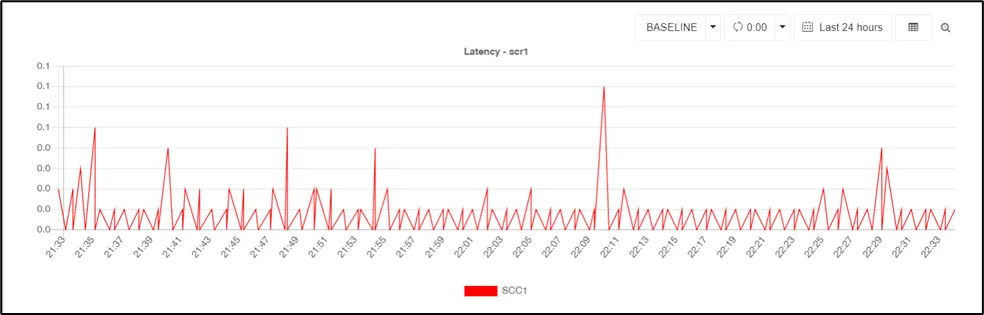
Latency Chart