Alarm Threshold Set up
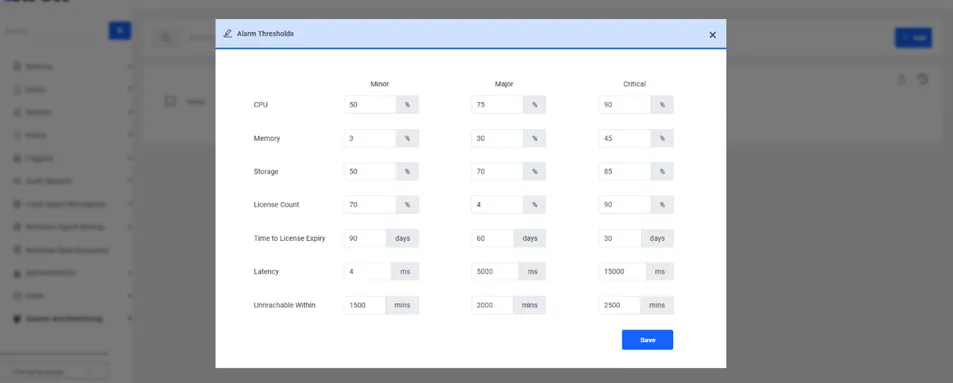
In this tab, the following alarm thresholds can be set for each severity level (minor, major, critical):
- CPU (in percentage)
- Memory (in percentage)
- Storage (in percentage)
- License Count (in percentage)
- License Expiry (in days)
- Latency (in milliseconds)
- Unreachable Within (in minutes)
- The Unreachable Within parameter specifies the duration of communication disruption between Kron PAM servers in an Active-Active redundancy setup. If this threshold is exceeded, the other Kron PAM server is marked as unreachable.
When opening the screen, the previously defined values are automatically displayed. All thresholds can be edited and updated by the user and saved using the Save button.
For storage alarms to function correctly, proper mapping between alarm definitions and disk usage monitoring is required.
Disk usage values are collected by the pam-diag.sh script, based on mount points defined in the pam-diag.config file. The relevant parameters in this file are:
· OSMountPoint=/
· AppMountPoint=/pam
· DataMountPoint=/pam/PostgreSQL11
The script reads these mount points and periodically calculates disk usage by executing the df -Pk command. Collected data is written to the sc_diagnostics table using the corresponding fields:
- os_disk_usage
- app_disk_usage
- data_disk_usage
When defining storage alarms in the Alarm Parameters tab, each alarm type (e.g., OS, Application, Data) must be associated with a distinct mount point. If multiple mount definitions refer to the same physical disk, identical values will be recorded, and alarm behavior may overlap.
To ensure reliable monitoring, each logical disk to be monitored should be mounted as a separate physical volume and referenced accordingly in the configuration file.