Agent Status Information
The Agent Dashboard shows two independent indicators for each agent. The color of the operating system icon shows whether the agent enforces the policies on the endpoint, and the ONLINE or OFFLINE label shows whether the agent reaches Kron PAM. To see what the current state of an agent means, hover over the icon.
The following agent enforces the policies and reaches Kron PAM:

The following agent enforces the policies but cannot reach Kron PAM:

The following agent neither enforces the policies nor reaches Kron PAM:

The following table describes the states:
Table: Agent States on the Agent Dashboard | ||
|---|---|---|
Icon Color | Status Label | Message |
Green | ONLINE | Protection is enabled. Communication status: Connected. |
Green | OFFLINE | Protection is enabled. Communication status: Disconnected. |
Black | ONLINE | Protection is disabled. Communication status: Connected. |
Black | OFFLINE | Protection is disabled. Communication status: Disconnected. |
Red | ONLINE | |
Red | OFFLINE | |
Agent Heartbeat
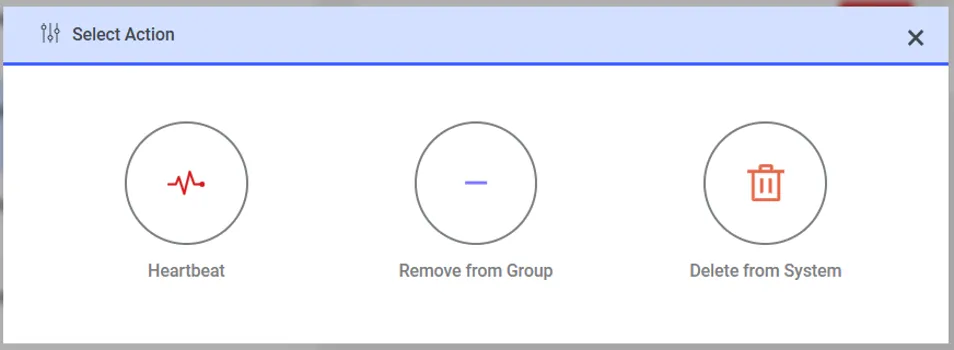
The agent sends heartbeats to Kron PAM at regular intervals. The ONLINE and OFFLINE labels on the Agent Dashboard reflect these heartbeats. To see the heartbeat history of an agent, click the actions button on the agent card, and then click Heartbeat in the Select Action window:
Kron PAM opens the heartbeat window of the agent. Two lists at the top of the window define what the window displays: the first list defines how often the window refreshes the data, and the second list defines the period that the window covers.
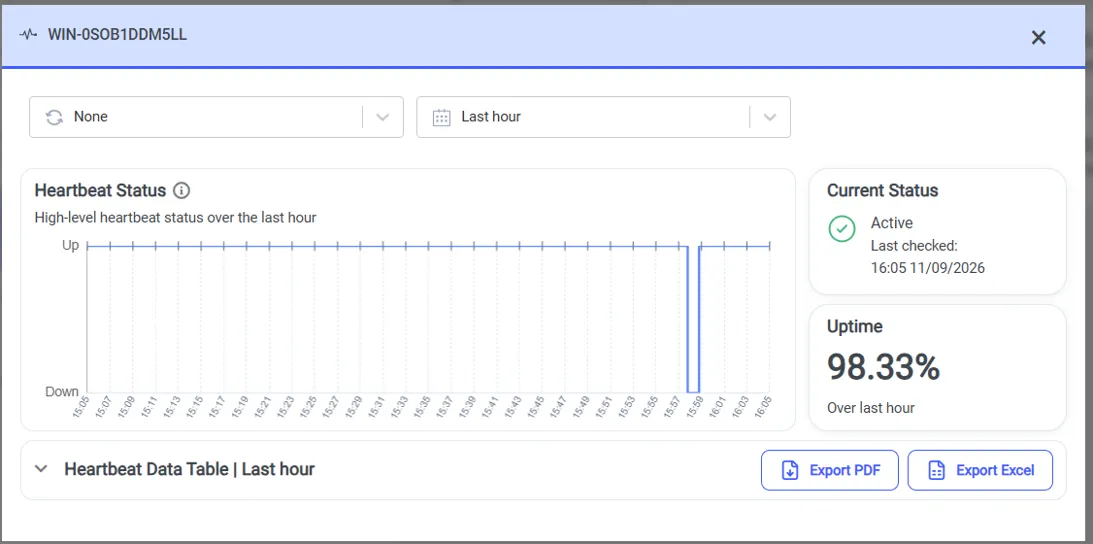
The window displays three panels:
- Heartbeat Status shows the up and down periods of the agent on a timeline.
- Current Status shows whether the agent is active, and the time of the last heartbeat that Kron PAM received.
- Uptime shows the percentage of the time that the agent was up during the selected period.
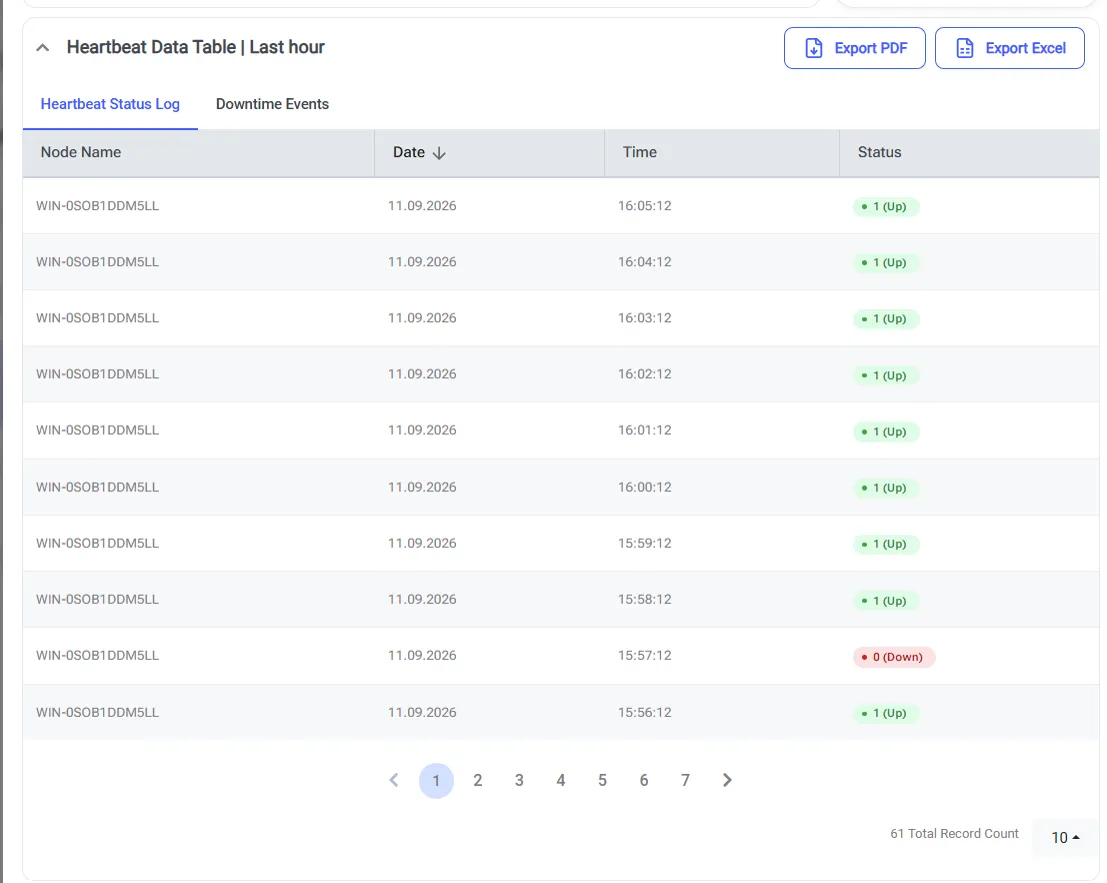
To see the individual heartbeat records, expand Heartbeat Data Table. The Heartbeat Status Log tab lists every heartbeat with its node name, date, time, and status. The Downtime Events tab lists only the periods when the agent was down. To download the records, click Export PDF or Export Excel: